 Power Subsystem Analysis: in STK Pro.
Power Subsystem Analysis via Solar Panels onboard a satellite is possible with STK Pro, STK Premium Space, STK SOLIS and STK Scheduler. Each has unique approaches and variable levels of fidelity all used to calculate different portions of power analysis for a satellite.
This is a guide to analyzing Power Generation in STK Pro!
Calculating solar panel power generation based on the angle to the sun and area involves a few key steps:
- Determine the solar intensity: Solar intensity is the power received from the Sun in the form of electromagnetic radiation. STK can generate the Solar Intensity with values from 0 to 100. Generally for LEO satellite, the intensity goes quickly from 0 to 100, but other orbits could have longer Penumbra times where intensity would be variable from 0 to 100 instead of a seemingly a step function at LEO.
- Calculate the effective area: This is the area of the solar panels that is exposed to sunlight. It depends on the tilt angle of the panels relative to the sun's position. This is available to calculate in STK.
- Apply efficiency factor and Calculate Power Generation: Solar panels have an efficiency rating, which is typically a percentage representing the conversion efficiency of sunlight into electricity. Multiply the effective area by the efficiency factor to get the actual power output. The efficiency is an input into the analysis.
Here's a more detailed breakdown:
Step 1: Determine Solar Irradiance
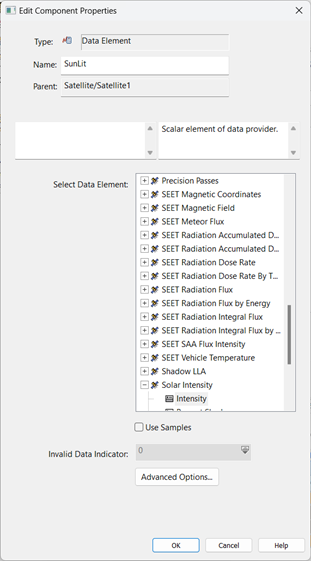
To create the Solar Irradiance, we can use the data providers in STK and bring them into the Analysis Workbench. We need the AWB for later calculation. Below shows how to pull the Solar Intensity as a new Scalar using the Data Element option.
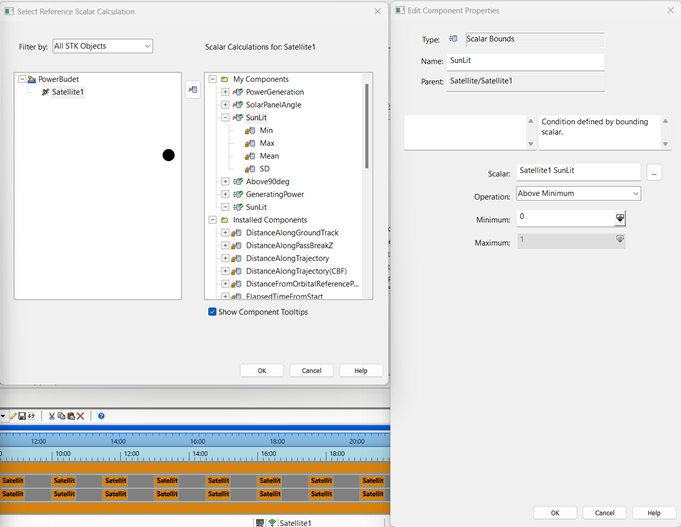
Then create a new Scalar Bounds, and bring in the SunLit Scalar in. Then set the Scalar Bounds to be above 0 solar intensity. This will capture the start of the lighting times, prior to full sun, Penumbra but not Umbra where its total darkness. There are other Sunlighting times you could use but it also shows flexibility of AWB to create your own.
Note: Due to very low values 1e-6 type values, you need to use a minimum of 1 instead of 0 as shown below.
Step 2: Calculate Effective Area
The effective area of the solar panels exposed to sunlight depends on their tilt angle relative to the position of the sun. The angle between the direction perpendicular to the solar panel surface and the direction of the incoming sunlight affects how much sunlight is captured.
You can use trigonometry to calculate the effective area. If you know the tilt angle of the panels (?θ) and the total area of the panels (?A), then the effective area (?effAeff) can be calculated as:
?eff= A ×cos(θ)
Area would be constant and based on your 3D model. You will need to find the total panel size of the 3D Model or estimate.
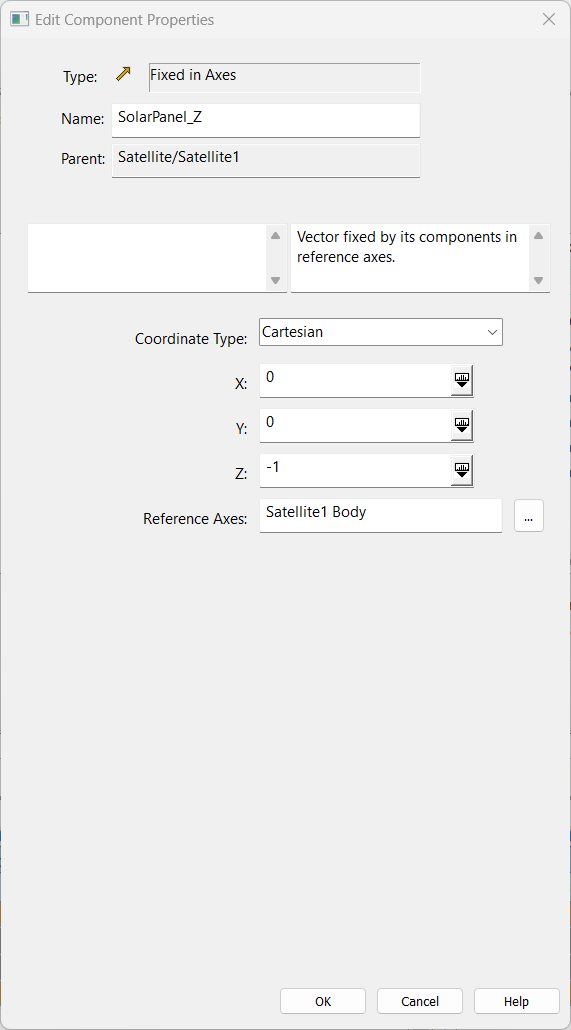
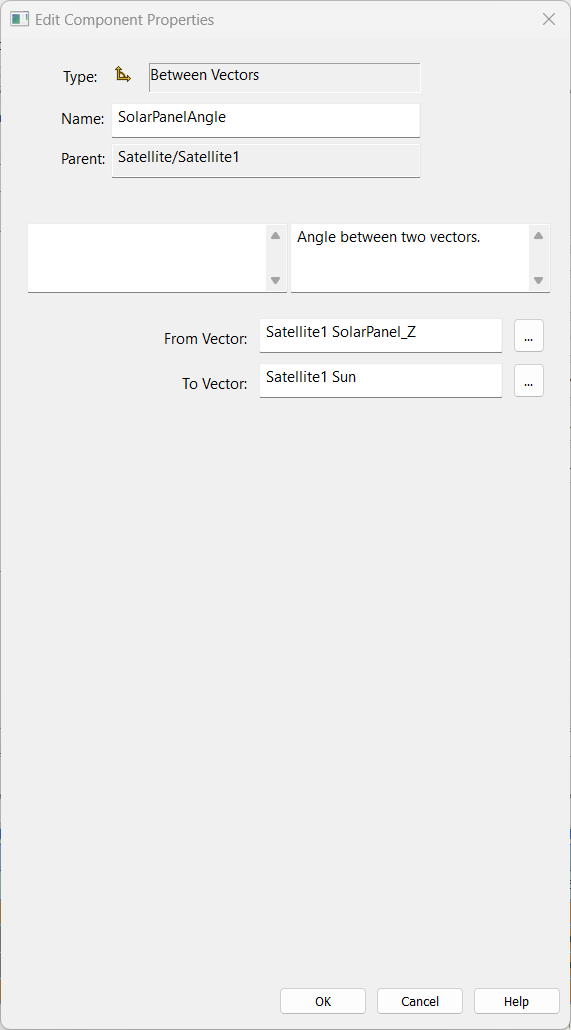
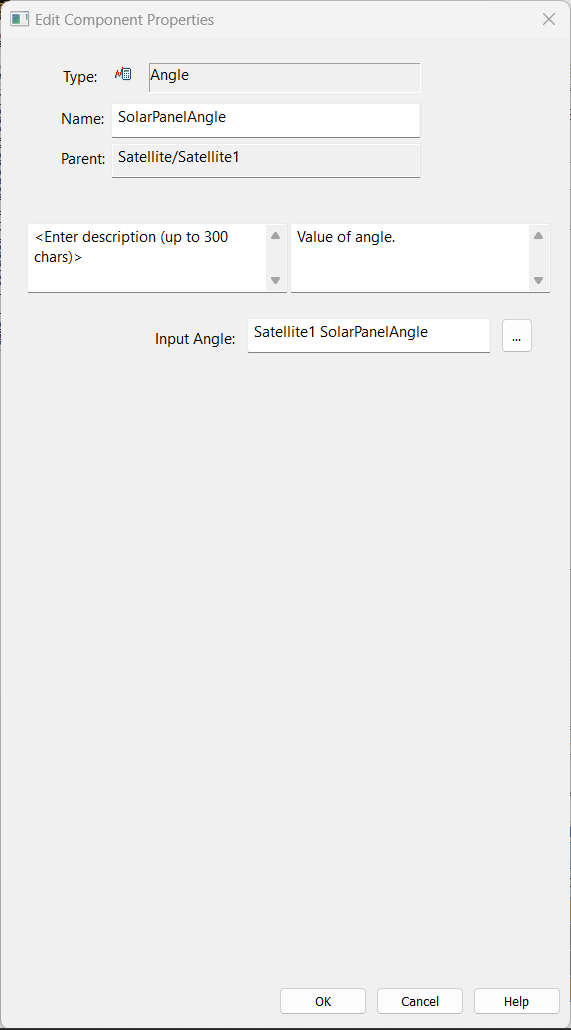
Theta is changing and we can use STK to calculate it. First you will need to create the direction of the solar panel. Below you can see the Vector I created is a Negative Z fixed solar panel, with Negative Z aligning towards Zenith (This is the attitude of the vehicle). Then create a new Angle that is the angle between the solar panel vector and the sun vector. See image below.
So you would need to repeat for each solar panel direction.
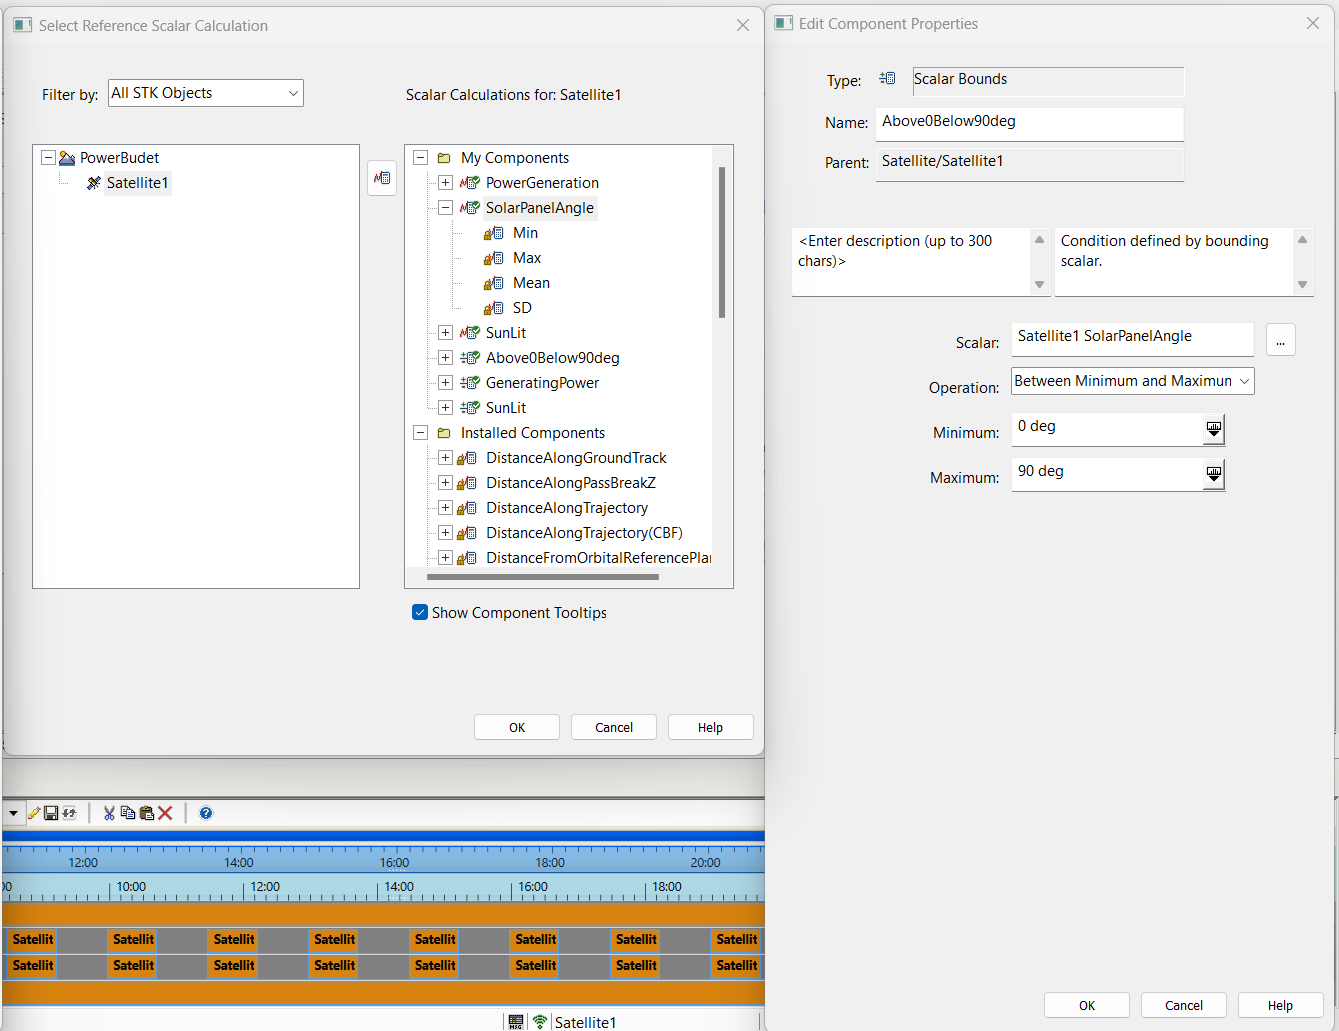
Bring in the Angle into the Scalar and call it SolarPanelAngle. This allows it to be in the calculation values. Then create a scalar bounds. This scalar bounds should be for the SolarPanelAngle and it should be between 0 and 90 degrees. Beyond 90 degrees the Sun is not shining on the panels. This gives us the times when the panel has Sun light on it and we have the Angle when it is above 90 degrees.
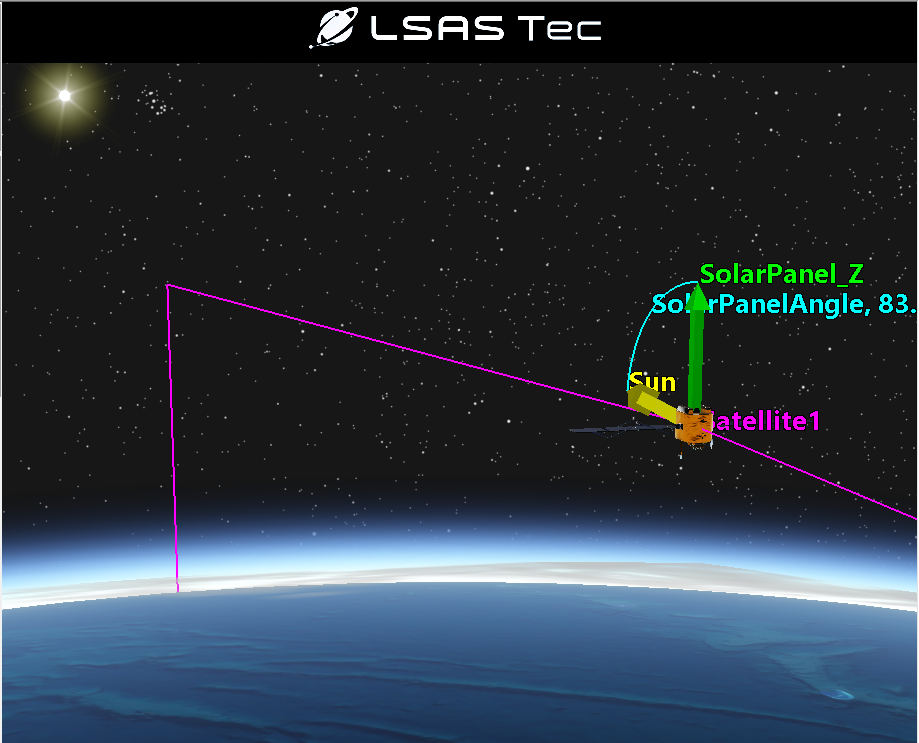
If you use the Satellite Properties > 3D Graphics > Vector, then select [Add]. These vectors and angles can be visualized in 3D. The image shows that the Sun must be high above the horizon to have an angle between 0 and 90 degrees and generating power.
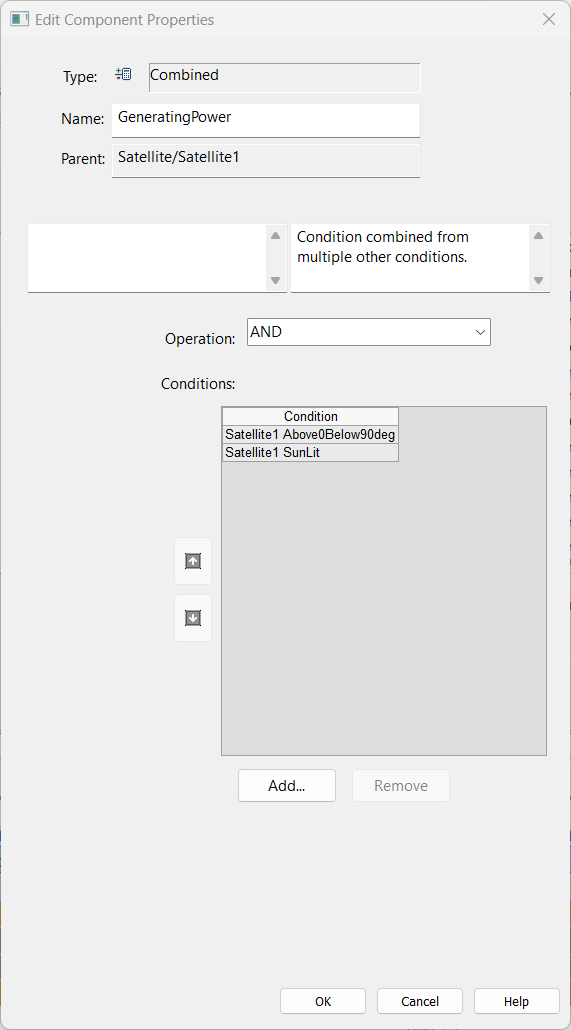
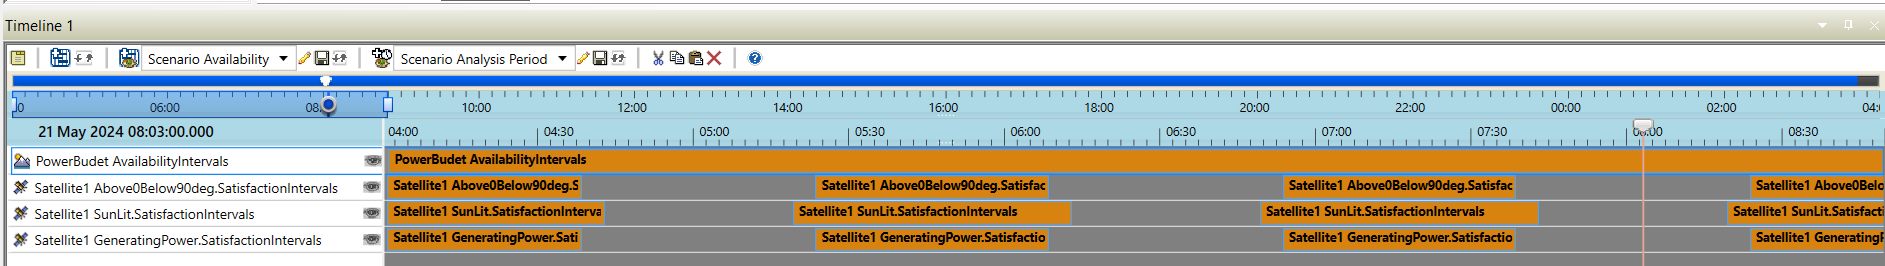
Combination of the two times. You must have both conditions to be true to have Power Generation, it must be in the Sun and the Angle from the Solar Panel Normal vector and the sun must be within 0 to 90 degrees. We can calculate those combined times.
Below is the Combined Scalar Bounds which adds a condition where both the SunLight and the Between 0 to 90 degrees are both true. In the Zenith Pointing the 0 to 90 degrees is the dominate time, but other configurations the solar panel angle to Sun might be 0-90 but the Sun is being blocked but the Earth.
Currently we have the Scalar Intensity, Area (Constant), Angle to the Sun and we have the times when the panel can actually generate power. The Effective Area calculation will be calculated into the total Power generation calculation, so we just have one equation. (continued below)
Step 3: Apply Efficiency Factor and Calculate Power.
Multiply the effective area by the efficiency factor of the solar panels to get the actual power output. Let's denote the efficiency factor by η.
Power output=?eff×Solar irradiance×?
Power output=?×?×cos(Solar Panel Angle to Sun)× Solar irradiance.
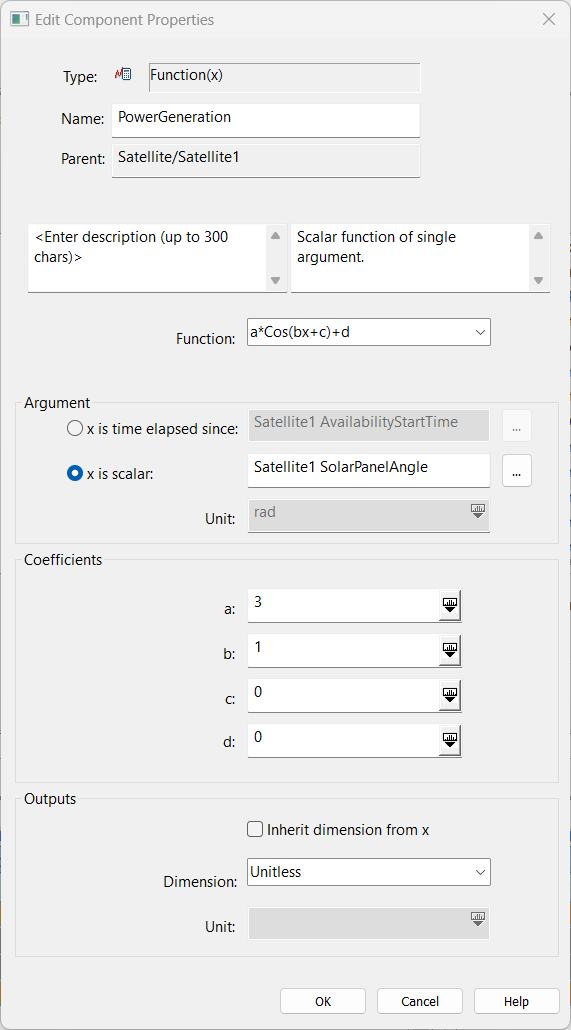
Create a new Scalar of type Function. I used the A*cos(B*X+C)+D. I set the A = 3 which is the area (10 meters) * the efficiency factor of (30%). B is 1 and X is the Scalar that we created for the Solar Panel Angle. Cos*SolarPanel Angle & Area is the Effective Area. Solar Irradiance is either 0% or 100%, so we have included that in the time-based constraint. If you want to add a Solar Intensity to the equation, you can use the Function (x,y).
Now we have the Power being Generated but we need to constrain it a little further. Finally, we need to output the Power being Generated only at the times when Power is able to be generated (Angle between 0 to 90 and the satellite is sunlit).
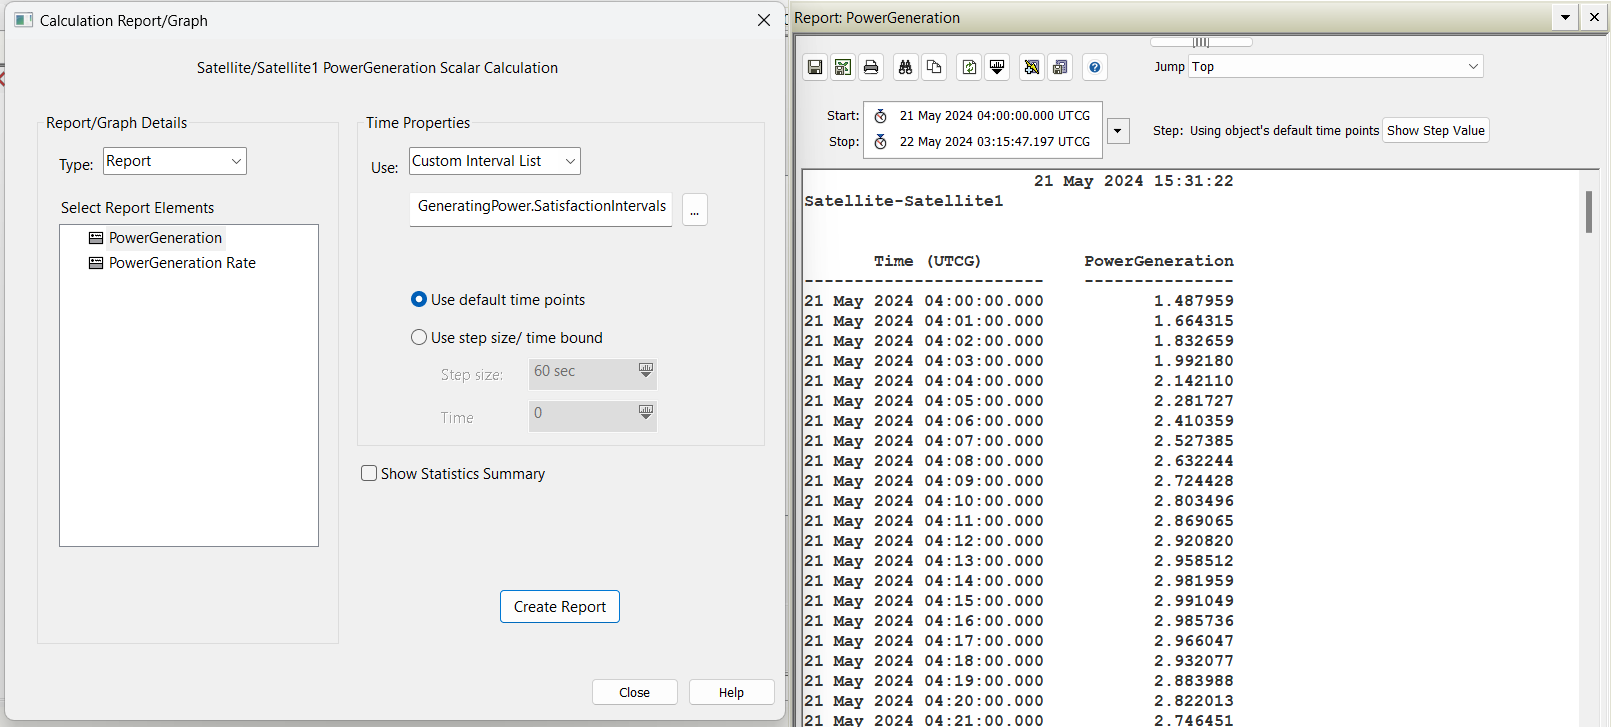
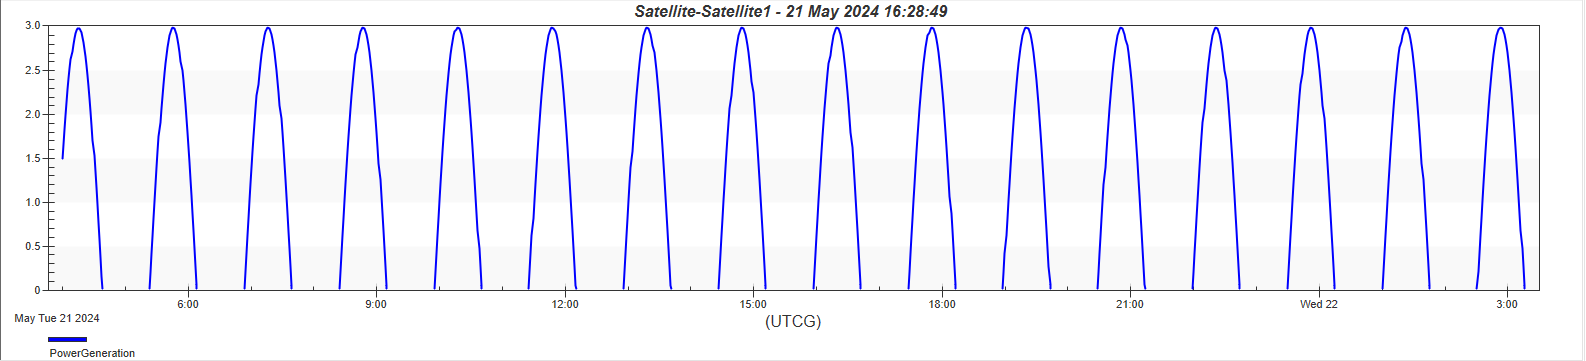
This gives you the Power Generation at all of the times that it can generate Power.
Complete.
More Analysis: There could be more analysis performed based on Contact Times, or Mission Times or Payload On-Times or General Power Loading. You can use the same sequences for Power Consumption as well. This allows for the additional analysis.
However, because you are pulling reports at specified times instead of all times, you would then need Excel to combine this analysis. I think there is a VLOOKUP for every minute looking to build your Power Budget:
Power Generated subtracted by each power Consuming Component. This is probably easiest to do in Excel.
Was this article helpful?
That’s Great!
Thank you for your feedback
Sorry! We couldn't be helpful
Thank you for your feedback
Feedback sent
We appreciate your effort and will try to fix the article