STK and CAT Tool can analyze the satellites who might rendezvous with eachother or are currently in Proximity with eachother. TLE data is freely available in the public standard object database. We can make it work and understand if something interesting is happening in space between two assets.
Background: Shiyan 23 and L-SAR-01-B
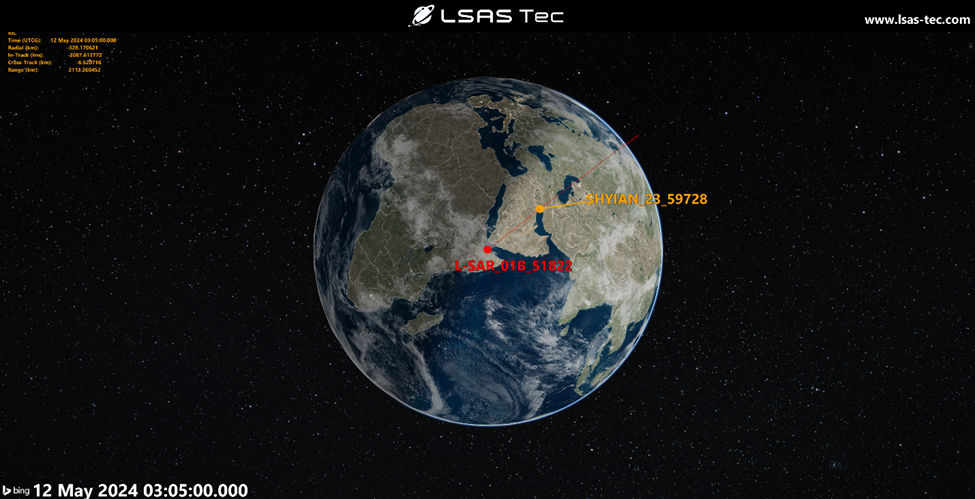
The example analysis that we will run is monitoring Shiyan 23. The goal is to find and analyze its close approach with L-SAR-01-B. Shiyan 23 is one of the latest satellites from the PRC (People’s Republic of China) that has been launched on the 12th of May 2024. The payload has been officially declared as used for space environment monitoring, but its actual purpose is unknown. We want to analysis potential Rendezvous and Proximity operations using STK.
This analysis will only work with the TLE database from the specified day. If you use another TLE from the Future or Past, you will get different results. So, if you want to find the same results as below, please perform these steps. Let’s begin by creating a new scenario:
Properties of Scenario: (To Use Archived Database)
- Basic > Time:
- Start Time: 12 May 2024 00:00:00.000 UTCG
- Stop Time: 15 May 2024 00:00:00.000 UTCG
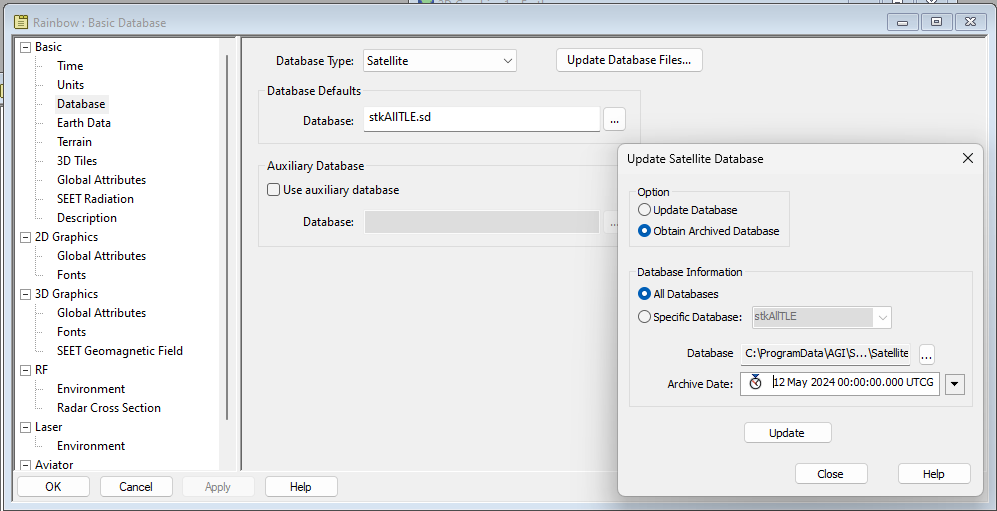
- Basic > Database:
- [Update Database Files]
- Select Obtain Archive Database
- Select All Databases.
- Set Archive Date: 12 May 2024 00:00:00.000 UTCG
- Select [Update]
Identifying objects sharing the same orbital plane as our satellite of interest
Usually, it seems that newly launched space-based surveillance satellites are proceeding with training and calibration on friendly assets. In this case, we will use STK to create a database that only contains Chinese assets. In order to do that,
Select the Create TLE File... button in the Utilities drop-down menu:

Once the Create TLE File window opens, select the Advanced Filter… button:
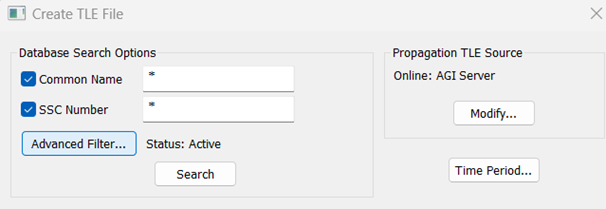
In the newly opened Satellite Database Advanced Search Criteria window, make sure that the “Active” option is ticked, then tick the “Owner” option and select “PRC” in the drop-down menu:

Click the Search button. Then select all results by clicking the first of the list and scrolling down to the last, Maj+Click the last of the list.
Click the Create File…
Name your file AllChinese and select the save as type option as a .tce file:

Now you have created a filtered TLE database with only Active PRC satellites included. Other satellites will not be included in the Analysis, only satellites that match this filter will be used.
Now let’s see which satellites were in close proximity to Shiyan 23.
You can insert Shiyan 23 by selecting Insert and click on New…

And select the Satellite object type, with the From Standard Object Database method, and then click Insert…

In the Search Standard Object Data window, enter “Shiyan 23” in the Name or ID field and click the Search button.

We will start using the Advanced CAT Tool.
Select Insert and click on New…

In the list of available objects, select the AdvCAT object and the Define Properties method then click Insert… button at the bottom right of the window

Once you reach the properties window of your AdvCAT object, you can use your Shiyan 23 newly defined satellite as your primary and your AllChinese.tce database file as your secondary. Make sure to tick “Use Range Measure” and “Display Acknowledgment when done” boxes. Enter the value you would prefer to use for the Threshold. In this case, I used 8km to single out as many secondaries as possible and keep only the closest encounters:

Click Compute. It may take some time.
Now let’s create a custom Report to observe the close encounters by duration.
Right click on the AdvCAT Object and select Report & Graph Manager.
Click on the Create new report style button to create your custom report

In the newly prompted window, select the following Data Providers from the Events by Duration folder and input them in the Report Contents list using the right arrow button between Data Providers List and the Report Contents List
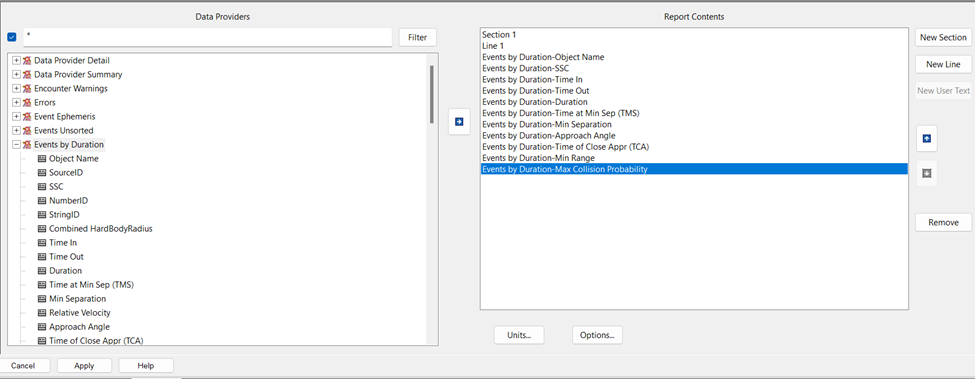
Then click Ok and double click on your new Report to open it.
Once it opens, select Bottom in the Jump drop down menu to see the encounters with the largest durations. You will notice that an SSC is coming back regularly as the secondary of interest with the largest number of encounters which also have the longest durations: 51822

Since this is the object with the encounters that are lasting the longest, it has become our primary satellite of interest for a potential RPO analysis.
Here, you performed the first filtering in order to be able to study a specific asset of interest. Let’s insert 51822.
Using the same method as the previous satellite, we will insert the 51822 SSC with the From Standard Object Database method. Simple input 51822 in the Name or ID field

We now have a name for our most likely suspect: L-SAR-01-B.
Once inserted, we already notice that the two satellites share a similar orbital plane:
Orbital analysis
Now that we have a serious candidate for our secondary object, we can use STK’s graphing tool to visualize better how close our two objects were to one another. Let’s create a RIC(Radial, In-Track, Cross-Track) graph!
In the Object Browser, right click on the L-SAR-01B Object and select Report & Graph Manager

In the Object list, L-SAR-01B should be highlighted already. In the Reports/Graphs Styles list, open the Installed folder and double-click on RIC graph. In the new window, make sure to assign SY-23 satellite object by selecting it and clicking assign, then click Ok

You should now see a new Radial, In-Track, Cross-Track ranges graph
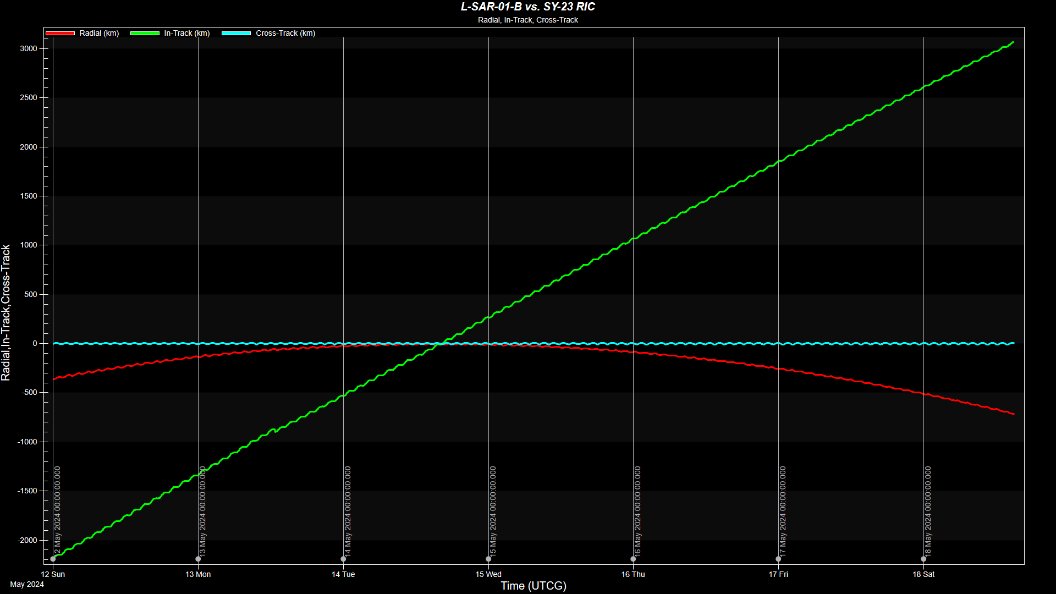
The graph shown here omits the range parameter to be more visually pleasant to read, but you should see a range curve leaning towards the bottom of the graph and reaching a value close to 0 when all Radial, In-Track and Cross-Track values cross the same point.
On this graph you are able to see that Radial and especially Cross-Track ranges values are extremely close between SY-23 and its target, meaning that they are already in a similar orbital plane. That indicates that all that SY-23 possibly has to do is drift in In-Track to reach L-SAR-01-B’s position.
This is exactly what we are seeing happening on the green In-Track curve here. SY-23 is slowly closing in and reaching the same True Anomaly (or position on the orbital plane) as L-SAR-01-B.
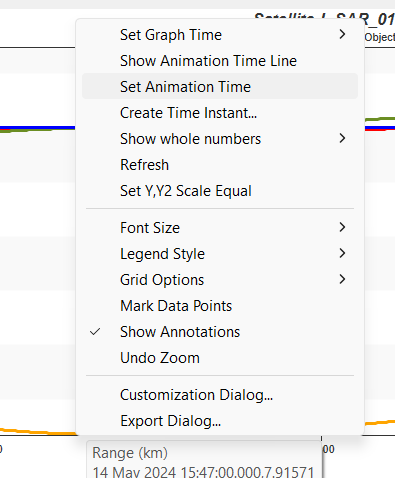
We can now check the 3D Graphics Window at the specific time at which we see the closest approach.
To do that, you can zoom in the lowest range value area on the graph, then right click on the point of lowest value and select Set Animation Time
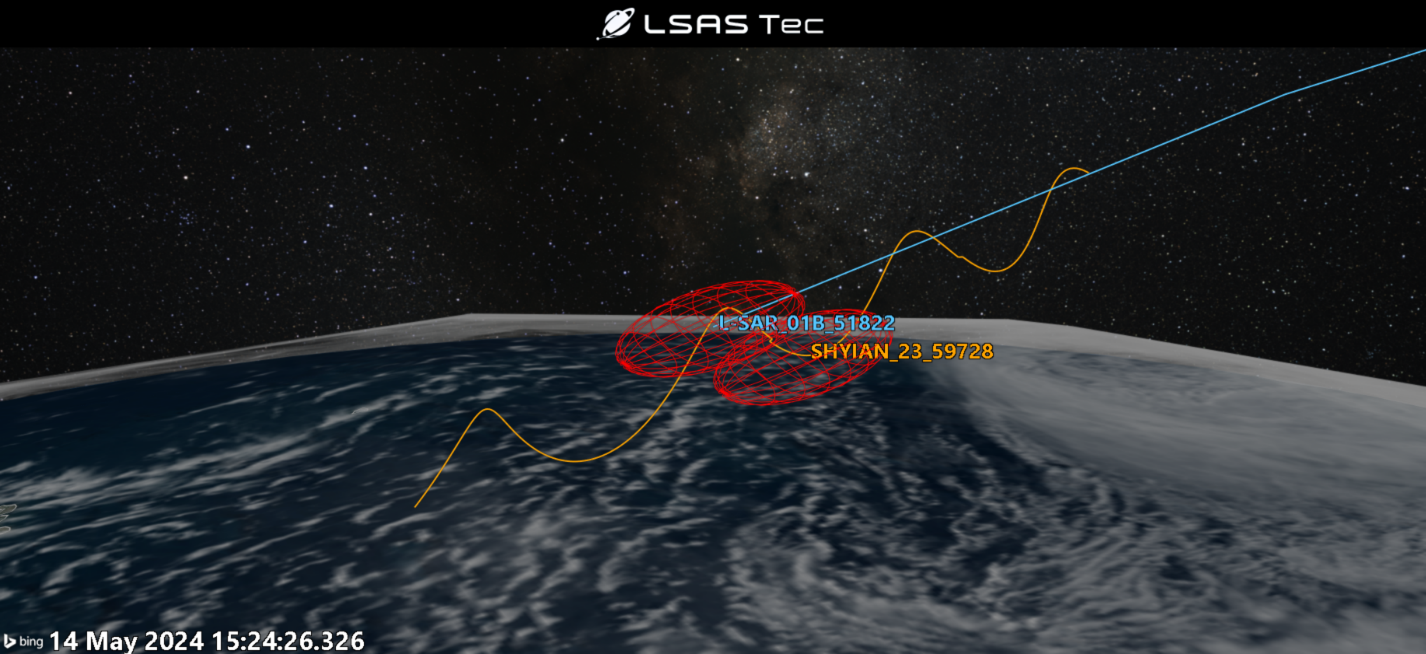
Then, in the 3D Graphics Window, if we zoom in to one of our two assets we will see them in close proximity. Let’s make it better and open SY-23’s Properties.
In the 3D Graphics Page – Orbit System, deselect Inertial by Window and click Add VVLH System. Select L-SAR-01B and click Ok. This orbit system will allow us to see Shiyan 23 relative to L-SAR 01B.
The VVLH coordinate system is particularly useful for describing the relative motion of nearby objects, such as in formation flying or rendezvous and docking scenarios. The VVLH frame aids in planning and executing maneuvers to approach and dock with another spacecraft. In our case, it is also useful to analyze the potentiality of such maneuvers to happen in the past.
Click Ok to close the Properties window and come back to the 3D Graphics Window.
You should be able to see the corkscrew pattern of SY-23 operating around L-SAR-01-B!
In conclusion, understanding the spatial relationships and potential interactions between satellites is crucial for satellite operators to ensure the safety and integrity of their assets. By utilizing tools like STK and the CAT Tool, operators can perform detailed orbit analyses. This knowledge is essential for all types of situational awareness.
Through the practical example of analyzing Shiyan 23 and L-SAR-01-B, we've demonstrated how to use STK to filter satellite databases, identify satellites of interest, and conduct proximity analyses. By following the outlined steps, operators can generate valuable insights into satellite behaviors and interactions, enhancing their ability to respond to potential risks.
The process of creating custom reports and graphs within STK further aids in visualizing and understanding these interactions, making it easier to pinpoint close approaches and potential inspections. As space becomes increasingly congested, the ability to perform such detailed analyses will become ever more important.
By mastering these tools and techniques, satellite operators can significantly improve their operational capabilities, ensuring they remain vigilant and informed about the dynamic environment in which their assets operate.
If you have any further questions or need assistance, we are here to help! Our dedicated Tec-Support team is ready to provide prompt and personalized assistance tailored to your needs. Please don't hesitate to reach out by submitting a ticket by going to https://lsas-tec.freshdesk.com/support/tickets/new. We look forward to assisting you and ensuring a positive experience.
Thanks,
LSAS Tec-Support Team
Was this article helpful?
That’s Great!
Thank you for your feedback
Sorry! We couldn't be helpful
Thank you for your feedback
Feedback sent
We appreciate your effort and will try to fix the article