
In this article we will learn how to use STK analysis tools to understand how to take advantage of the publicly available TLE Database that the Standard Object Database from AGI offers to determine the pattern of life of GEO assets.
Example Scenario: TJS-3
In our case, we will study a Chinese GEO satellite whose purpose is unknown. TJS-3 (Tongxin Jishu Shiyan) is believed to carry a multi-frequency and high-speed communications payload and is classified as a military satellite. Its possible missions include early warning and signals intelligence for the PLA (People’s Liberation Army).
TJS-3 has been launched on December 24th, 2018. Therefore, we will create a scenario with the following properties:
Properties of Scenario:
Start Time: 24 Dec 2018 00:00:00.000 UTCG
Stop Time: 1 June 2024 00:00:00.000 UTCG
Identify the different phases of life of the satellite of interest
From what little information we can find about TJS-3, it is known that it entered geostationary orbit a few days after its launch. If this is the case, we should see it orbiting Earth in a transfer orbit before it reaches its geostationary final orbit.
Since the TLE is being updated only a couple of times a day in the best-case scenario, we should also witness significant gaps in between the initial and final orbits.
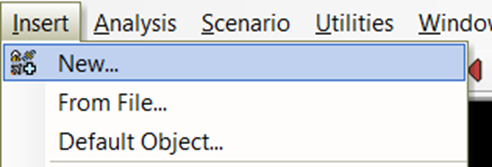
Let’s insert a new satellite object by selecting the Insert dropdown menu and New…
Select Satellite as the Scenario Object, and From Standard Object Database as the method before clicking the Insert… button

In the Name or ID field, input 43874 which is the Space Surveillance Catalog Number of TJS-3.
Click the Search button.
Select TJS-3 first result which is coming from the AGI’s Standard Object Data Service data source and click the Insert button and wait for the progress bar at the bottom right of the screen to finish the insertion before closing the Seach Standard Object Data window.

To have better visibility on TJS-3 in the 3D Graphics Window, open TJS-3’s properties and go to the 3D Graphics – Model page
Increase the Marker, Label maximum viewing threshold to the maximum value to be able to see the label from afar and click Ok

You should be able to see TJS-3 highly elliptical GTO (Geostationary Transfer Orbit) on the day of its launch

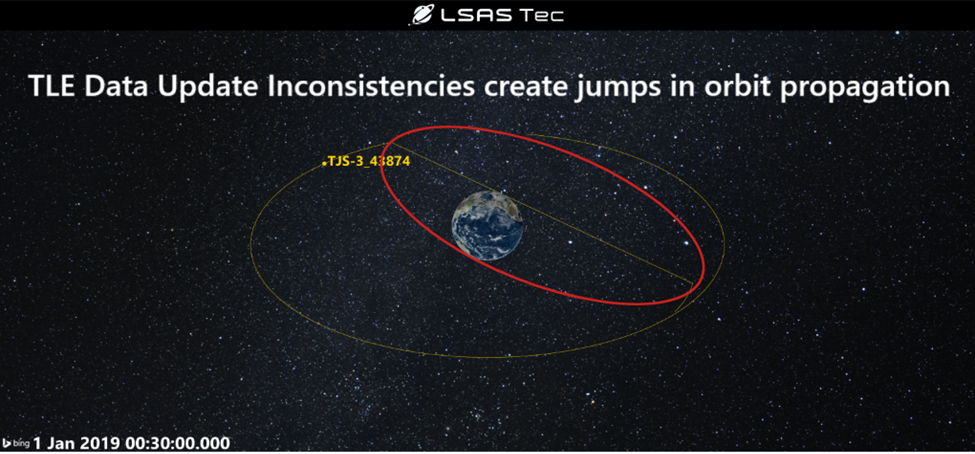
Now select the animation time and input the following date and time: 1 Jan 2019 00:30:00.000 and press Enter.
You will be able to visualize the consequence of the circularization into a GEO orbit of TJS-3, as well as consequent jump from one position to another after the update of the TLE
TLE updates are not consistent, and it is impossible to know when huge maneuvers such as orbit transfers or circularization happen, but it is possible to see the consequences of such maneuvers.
Here is what you should be able to see when pointing to the 1st of January 2019, with the jump that we mentioned earlier circled in red
This illustrates how important it is to have access to good, updated, independent data when it comes to orbit analysis. But even if we are using only TLEs, we can still do something about the study of our satellite of interest’s pattern of life!
In the Object Browser, right-click on our TJS-3 satellite object, and click on the Report & Graph Manager button
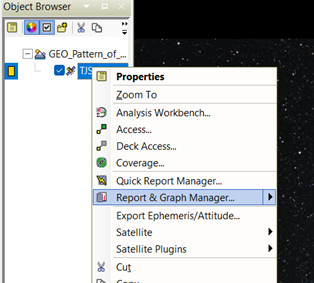
Make sure that TJS-3 object is selected in the left-side screen, and click on the Create new graph style… button
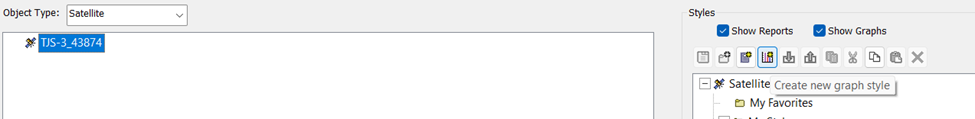
When prompted in the right-side list, enter the new name of your graph as Longitude and press Enter.
In the properties window of the new graph that just opened after your pressed Enter, type LLA in the filter field and click the Filter button.
Open the LLA State folder, then the Fixed sub-folder, and double-click on Lon to add the Longitude element to your graph
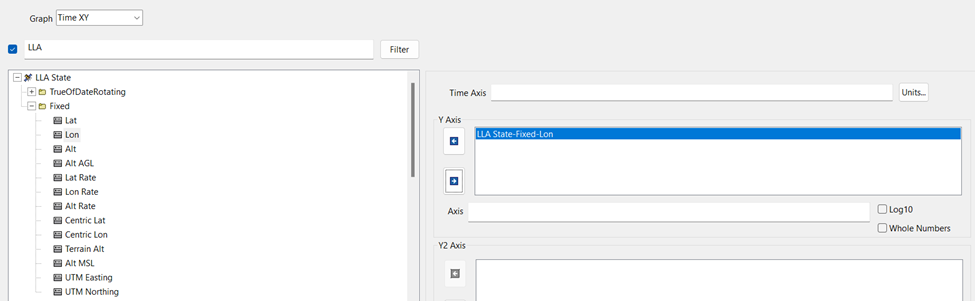
You can then click OK.
Then, you will see your new Longitude graph in your My Style folder. Double click to open it.
You should be able to see a similar trend over the last 6 years
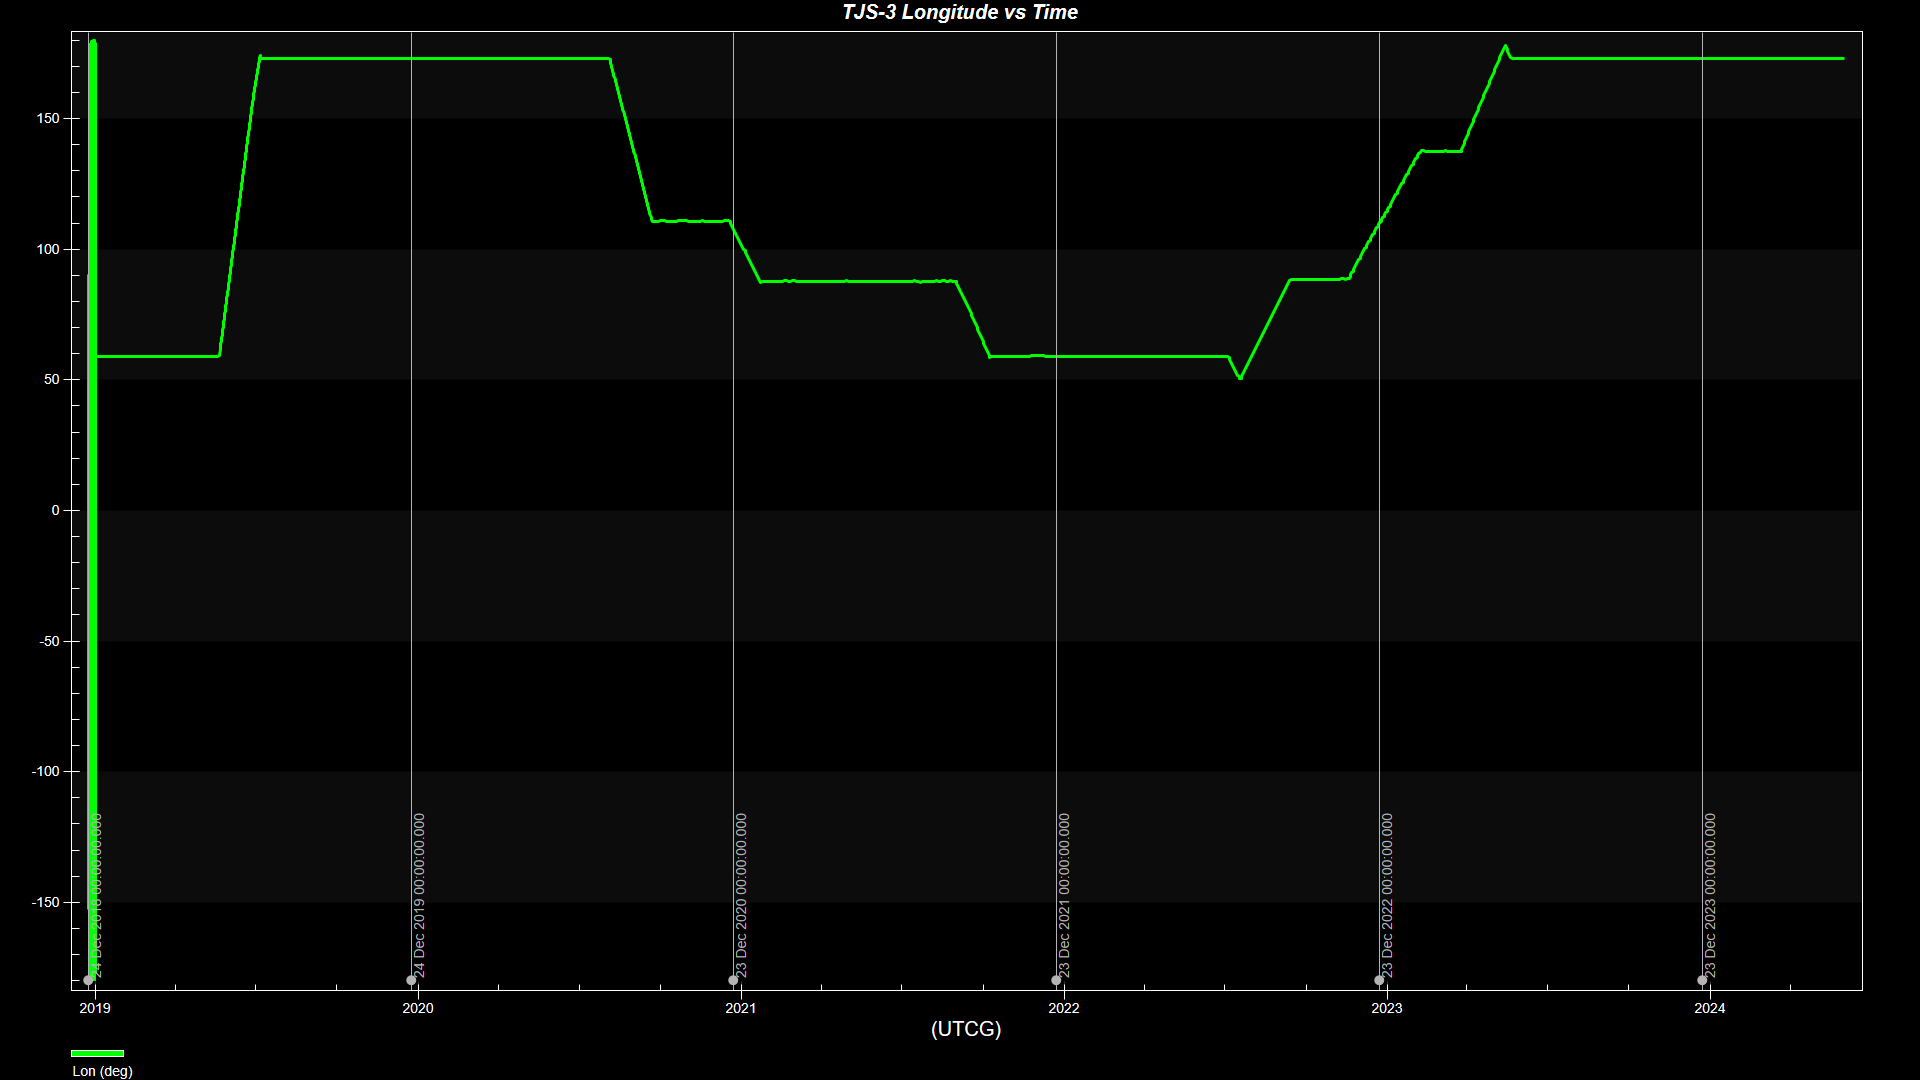
In the first part of the graph we can see a large jump in data due to the fact that the satellite was in a transfer orbit that wasn’t updated regularly until it finally settled to a first stable longitude range between 58.9 and 59.1 degrees between January 2019 and May 2019
In the first graph of this article, we can notice that despite settling for a few months on this stable longitude box, TJS-3 has changed at least 8 times longitude boxes. This could indicate that this satellite is not just executing a typical GEO mission and staying in a stable GEO slot, but that it is drifting to other position in the GEO belt to pursue SDA missions.
We can see than since the start of its nominal operations, TJS-3's longitude has been ranging from 59 to 173 degrees, staying in stable plateau patterns thanks to station keeping at its longitudes of interest.
This simple graph that you just created can really help understand better the trends of GEO assets and what could be their potential missions and risks. Once you understand if an asset is behaving in a suspicious way, you can study it more in detail and compare its position to your own assets. Was TJS-3 in any longitude range that matches one of your satellites? You can easily pinpoint that with STK, and even with publicly available data like the TLEs.
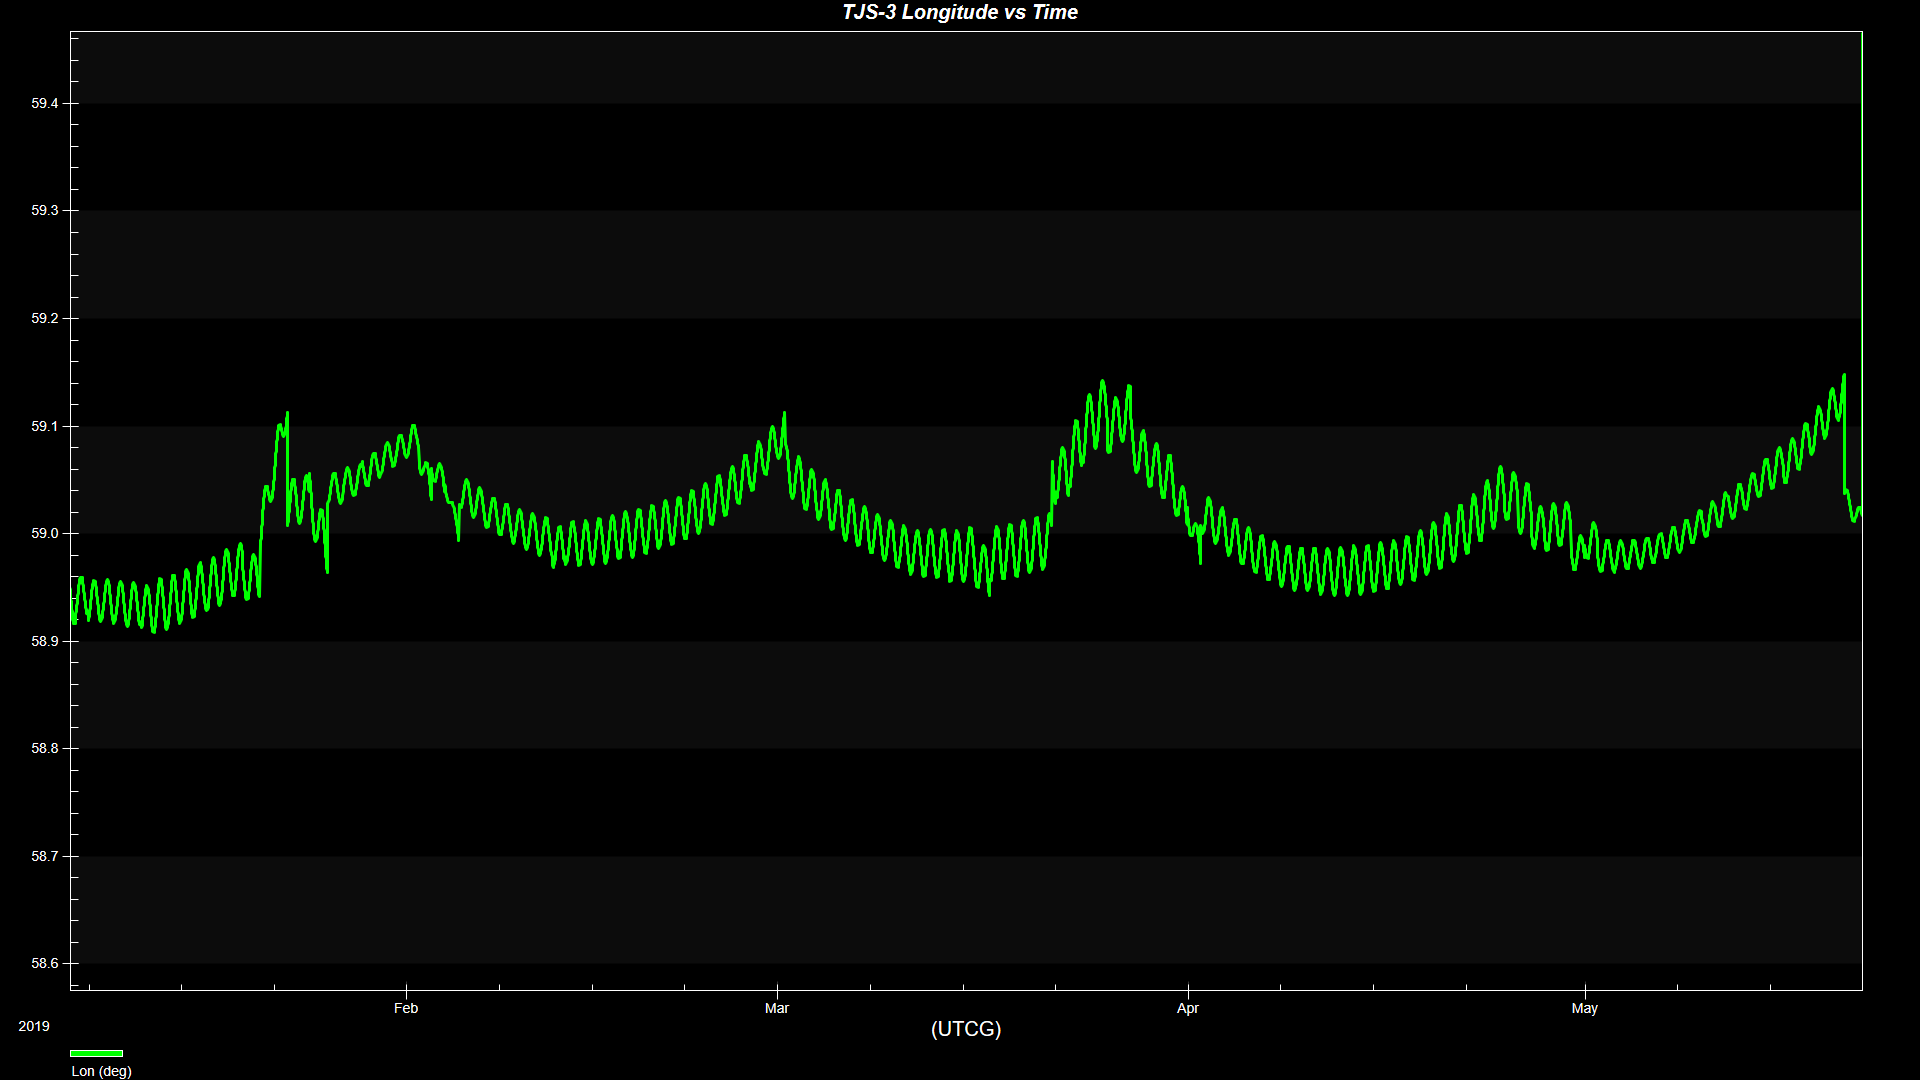
Now let's zoom to the latest longitude plateau of TJS-3 between June 2023 and June 2024:

Here we can observe that it longitude is maintained stable in a box situated between 172.9 degrees and 173.15 degrees approximately.
A 0.25 degrees box is pretty standard for GEO satellites.
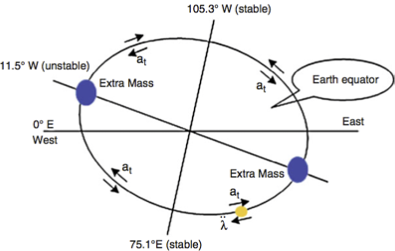
This figure displays the movement of a satellite in GEO. If a satellite is located at 0º longitude, it will drift to the nearest stable point, which is the 75.1º E longitude. Source: [6] H. Li, Geostationary Satellites Collocation. New York: Springer; Beijing, China: National Defense Industry Press, 2014, pp. 124.
On our graph, the longitude is expressed on a scale from -180 to 180, with 0 to 180 being an East Longitude. So we can consider that in relation to this picture, our longitude box is located between 172.9 degrees East and 173.15 degrees East.
Which means that TJS-3 is going to drift westward, towards the 105.3 degrees West stable point. In that regard, station-keeping maneuvers will happen to counter this westward drift which is observed in our graph as the longitude decreasing over time.
Regarding N-S station-keeping, we can verify the boundaries by repeating the steps that we used to create the previous longitude report but selecting the Lat data provider instead of Lon inside of the LLA State folder. You will obtain this graph for the duration from the month of July 2023 to the month of September
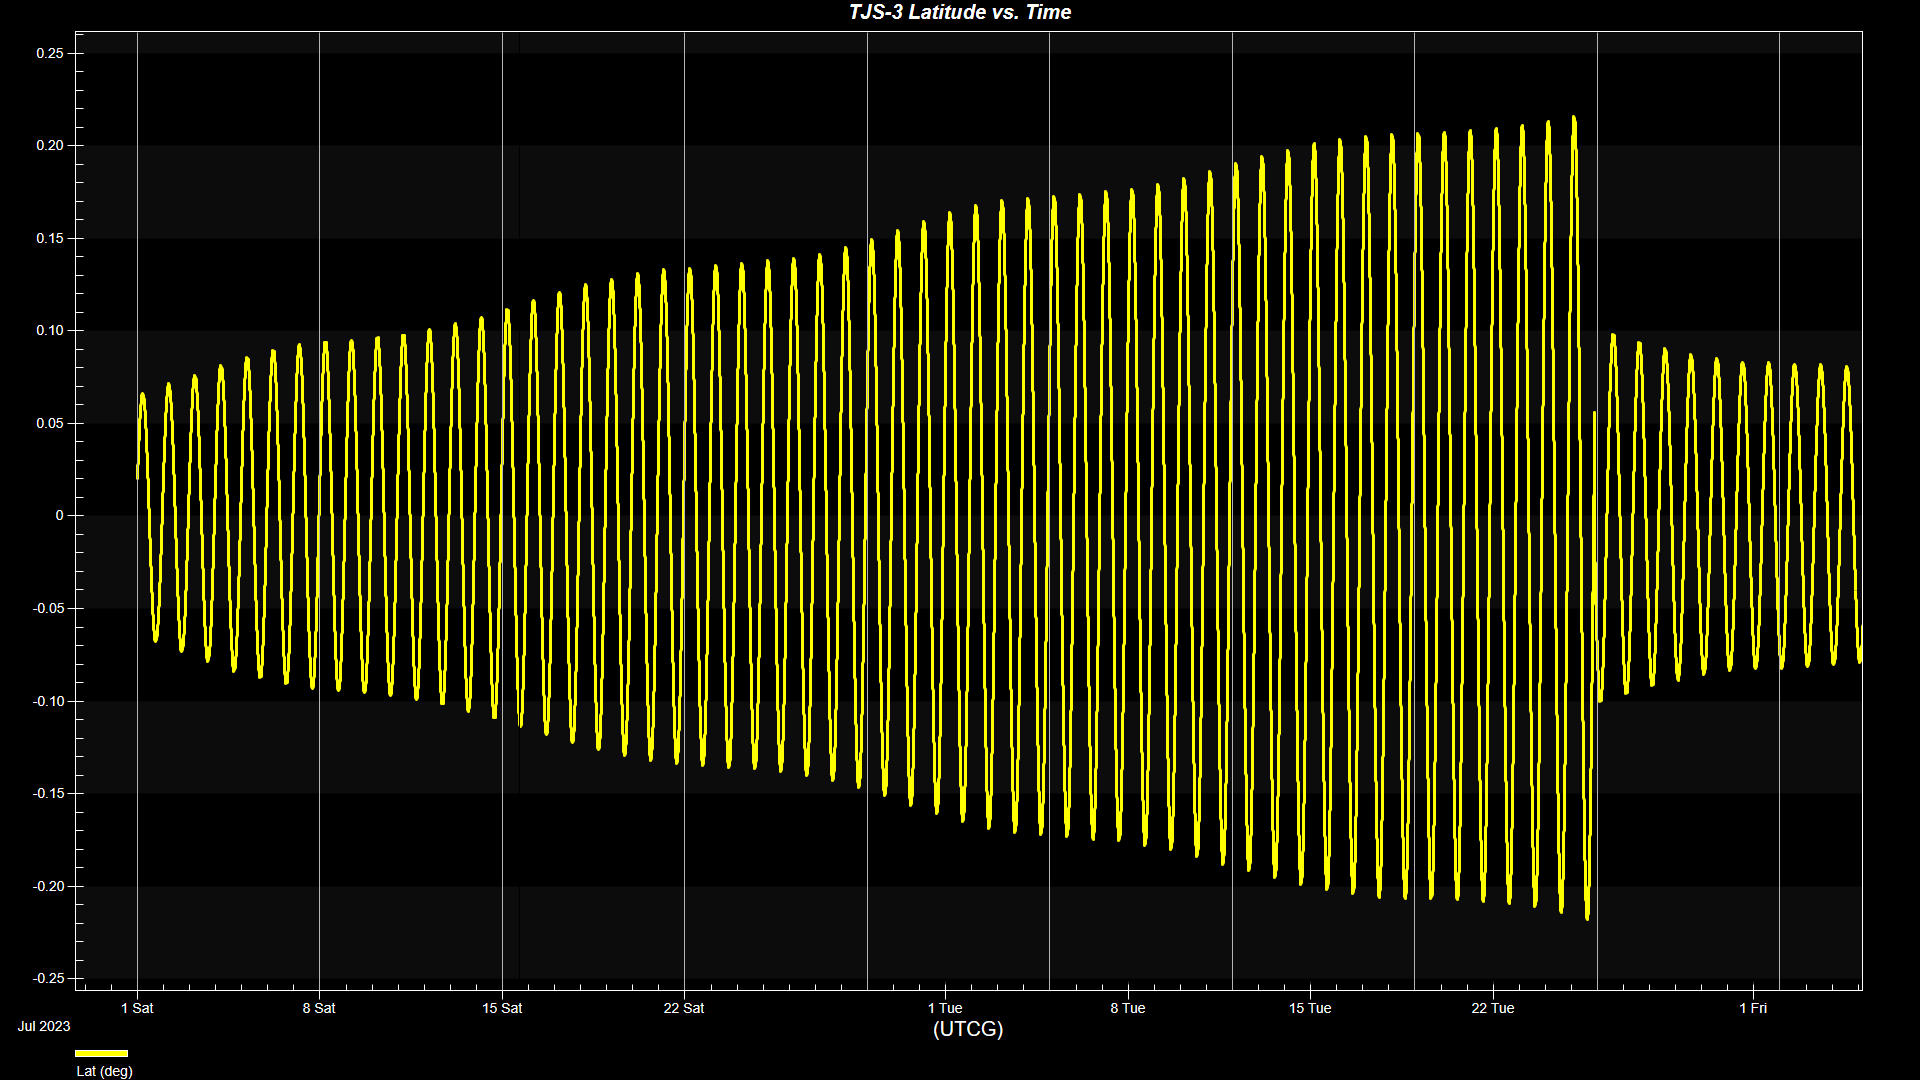
This should give an indication that the North-South station-keeping boundaries are located between -0.20 degrees and 0.20 degrees at maximum.
Now we can use these information to model the actual GEO station-keeping slot inside of STK.
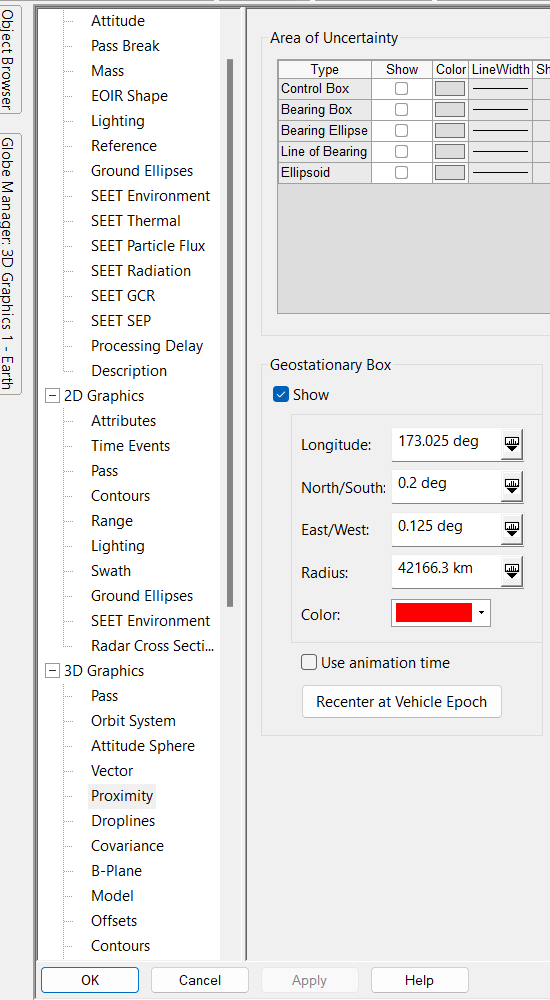
Open TJS-3's properties and select the 3D Graphics - Proximity Page
Make sure to tick the Show box and let's use the data we analyzed to create the GEO slot of TJS-3 from the 1st of July to the 1st of September 2023.
The Longitude field represent the median longitude point of our box, or center. We observed that the longitude oscillate between 172.9 degrees and 173.15 degrees so we can use 173.025.
We observed a range of 0.2 degrees on the N-S drift, so we will use this value for North/South.
Finally we can conclude that from 173.025 degrees, the satellite will drift westward to 172.9 degrees and that represent a 0.125 degrees change. We will use this value in the East/West field.
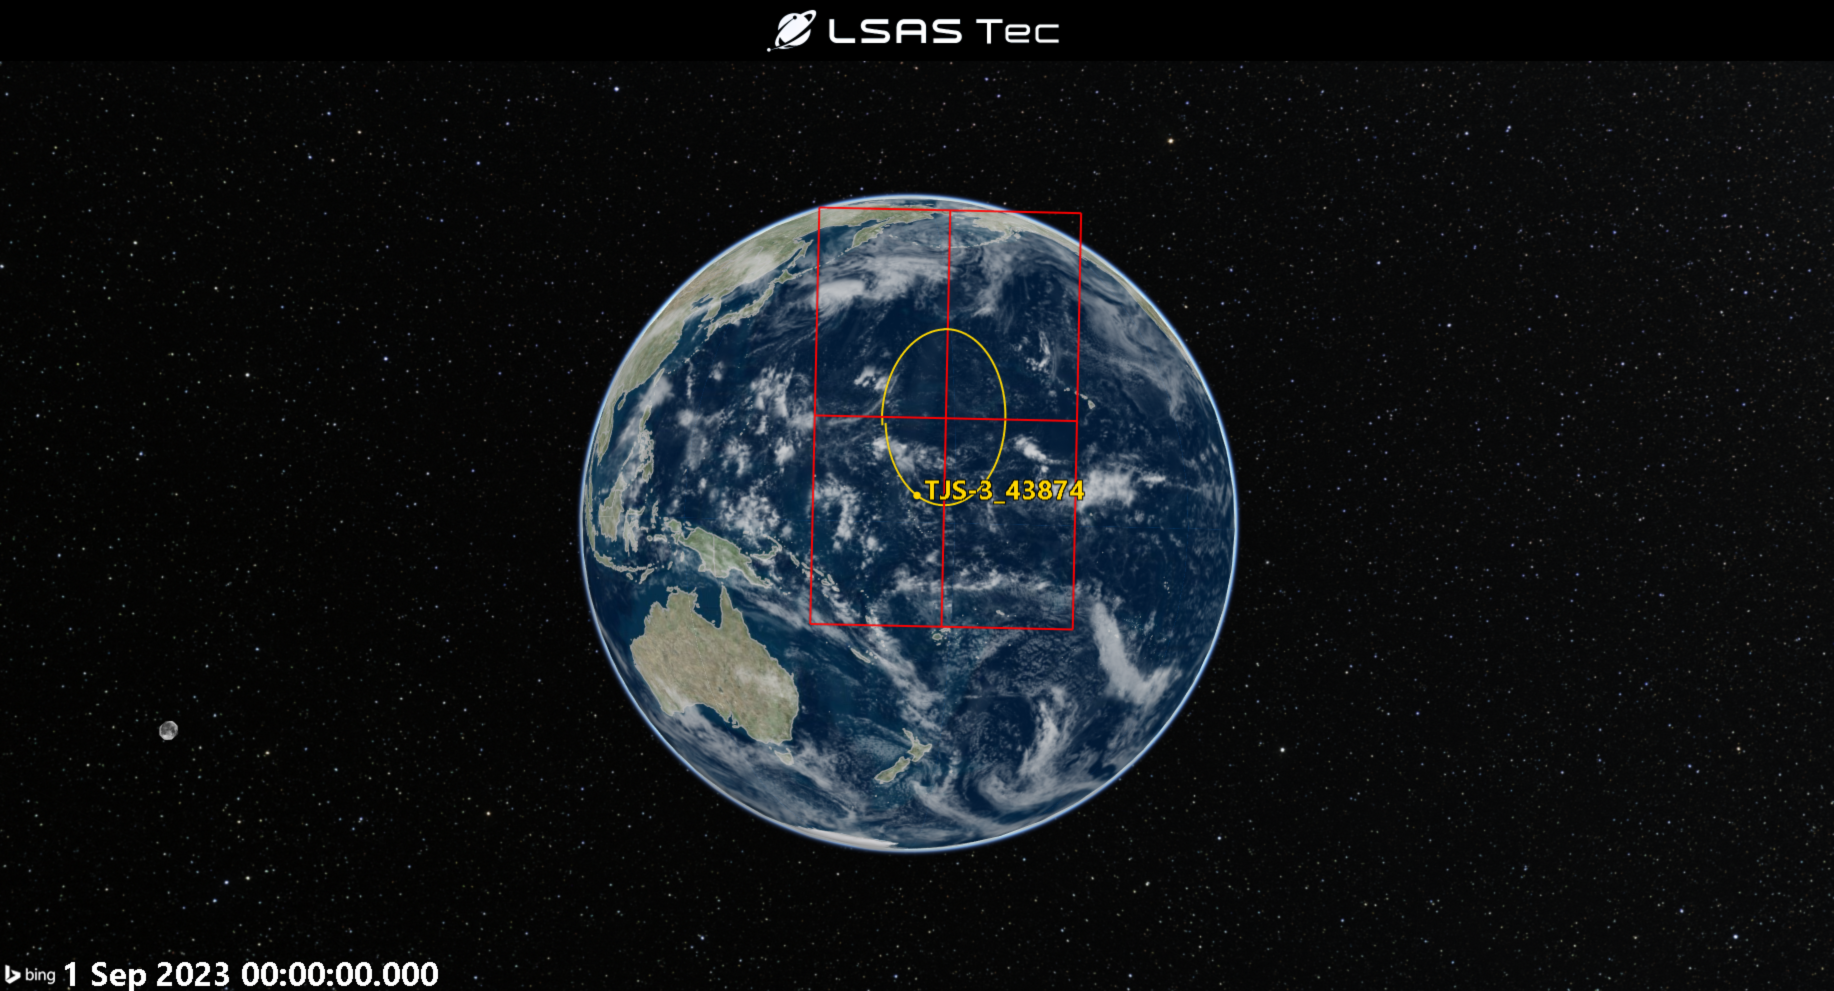
If you go back to the 3D Graphics Window, you will be able to see the new GEO slot box and animate your scenario from the 1st of July to the 1st of September 2023 and see that TJS-3 is not getting outside of the boundaries of the box, or it is rarely doing so
Thanks to STK, you managed to analyze real, publicly available data, to perform analysis on a GEO asset and better understand its role, pattern of life, and GEO slot.
We assessed that TJS-3 is highly maneuverable in the GEO belt, changing its longitude several times during a period of 6 years, possibly drifting to monitor other GEO assets. We also understood how to assess its different GEO slots and create a 3D representation for them in STK.
If you have any further questions or need assistance, we are here to help! Our dedicated Tec-Support team is ready to provide prompt and personalized assistance tailored to your needs. Please don't hesitate to reach out by submitting a ticket by going to https://lsas-tec.freshdesk.com/support/tickets/new. We look forward to assisting you and ensuring a positive experience.
Thanks,
LSAS Tec-Support Team
Was this article helpful?
That’s Great!
Thank you for your feedback
Sorry! We couldn't be helpful
Thank you for your feedback
Feedback sent
We appreciate your effort and will try to fix the article