Generating reports and charts which can be animated as time passes can make understanding the physics behind what happens in your mission easier.
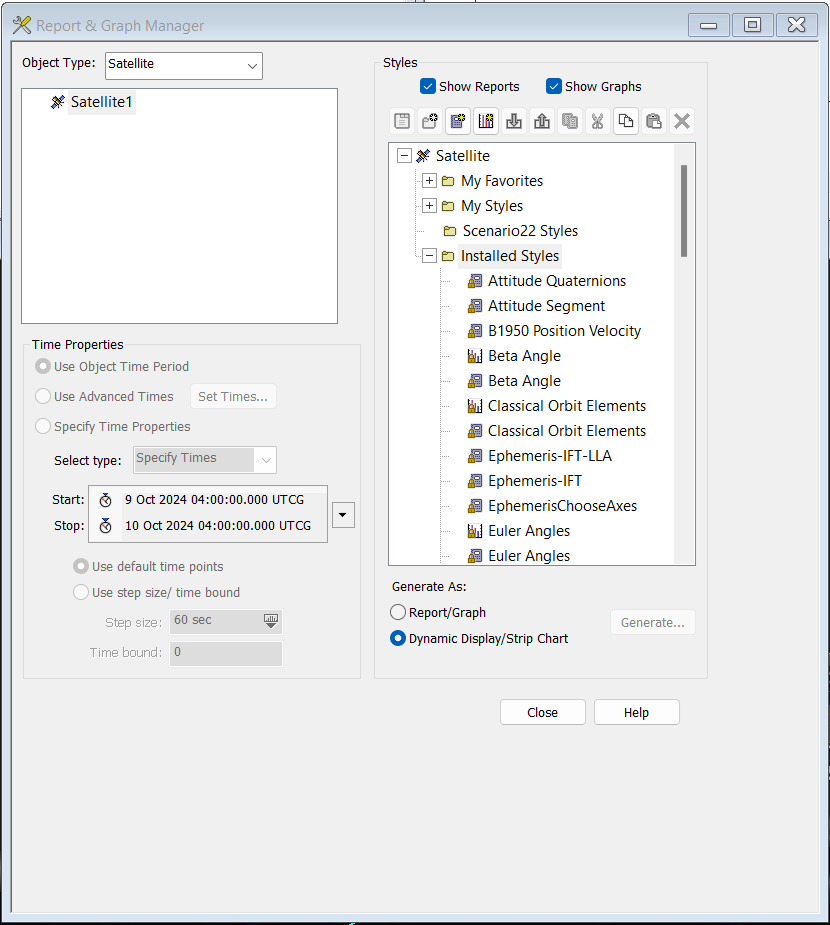
Thanks to reports called "Dynamic Displays" and graphs called "Strip Charts", it is possible to do that. Before generating a classic report or graph, select the option "Dynamic Display/Strip Chart".
Strip Chart functions as a Graph but updated the data as the scenario is played. Dynamic Displays functions as a Report in the same manner. These styles of graphs/reports can produce an operational picture with updating telemetry mimicking operations. When in Operations, STK can be sent position and attitude information to represent the real satellite in the virtual world. Below is an example of using the Dynamic Graphs and Strip Charts to mimic a satellite operational interface.
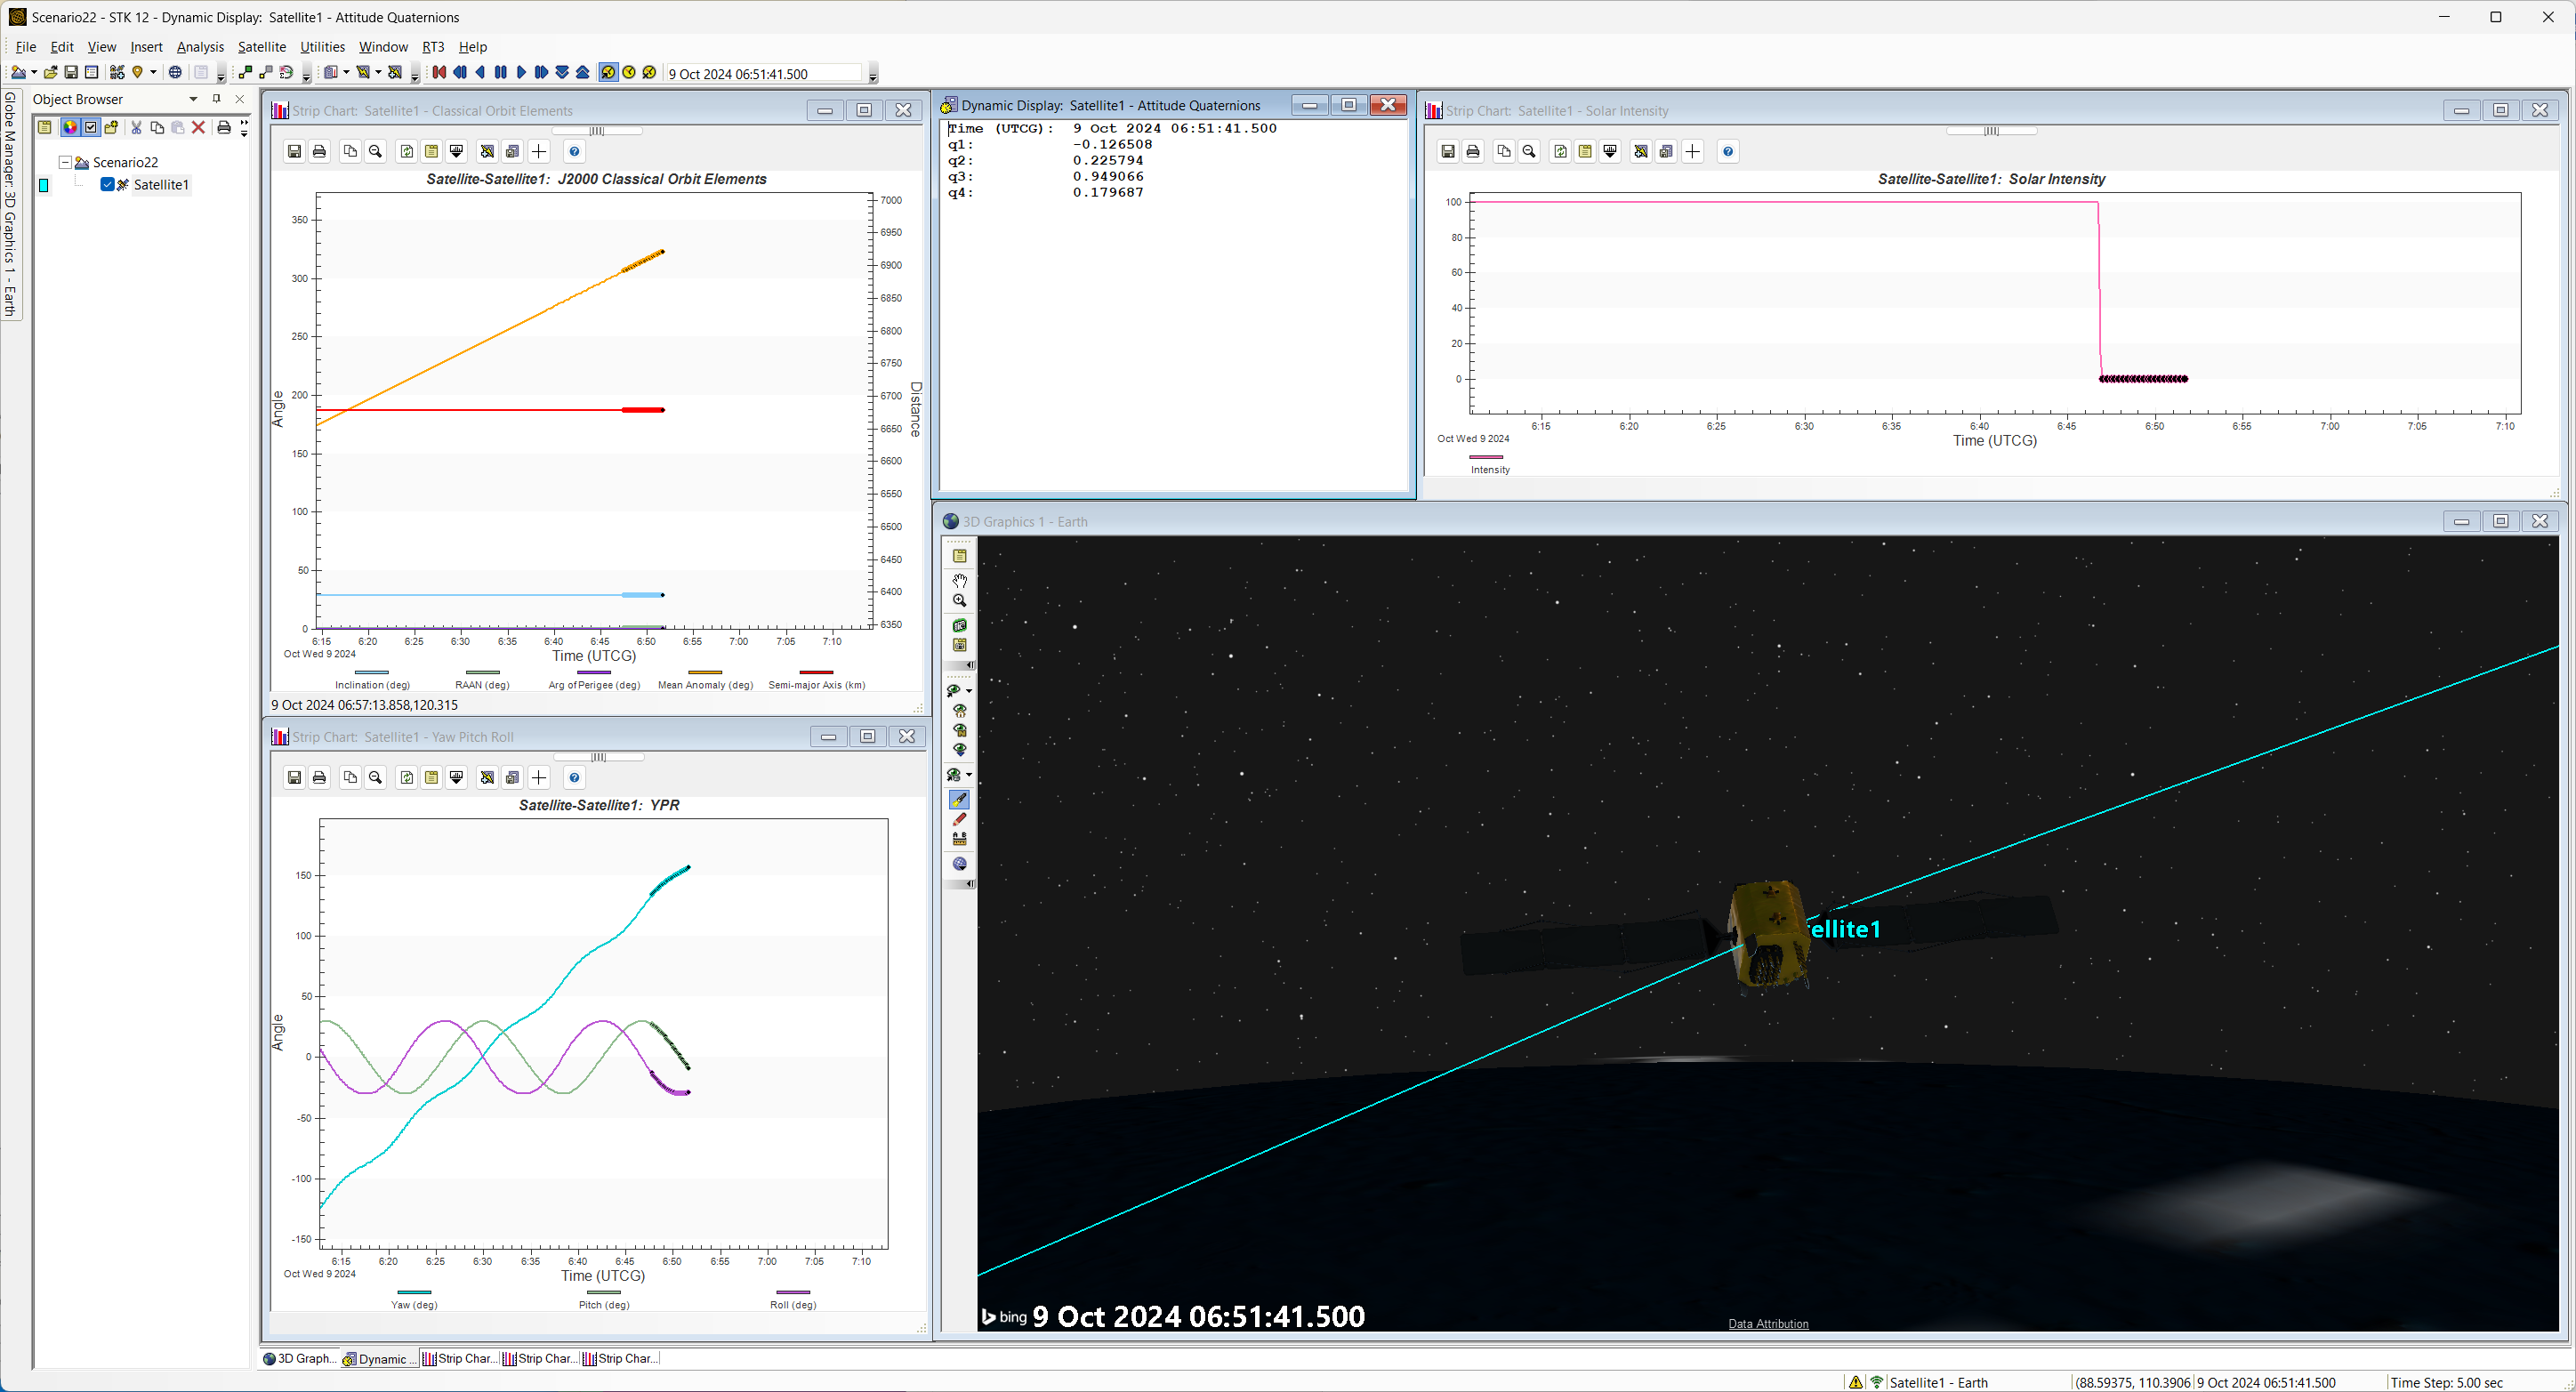
Strip Chart showing Yaw, Pitch Row of a spinning spacecraft.
![Untitled video - Made with Clipchamp (1).mp4 [video-to-gif output image]](https://s3.amazonaws.com/cdn.freshdesk.com/data/helpdesk/attachments/production/150084721308/original/k900xBt6PlOJTIe8vtU13ZtQm5i29G5Rwg.png?1728484431)
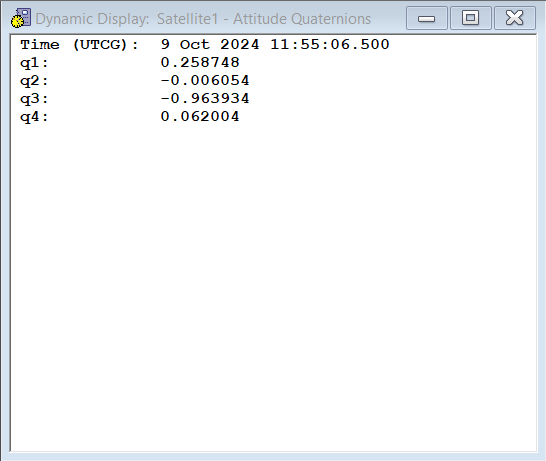
Dynamic Displays showing Quaternions.
A few notes are to be considered:
- You cannot generate strip chart graphs for multiple objects
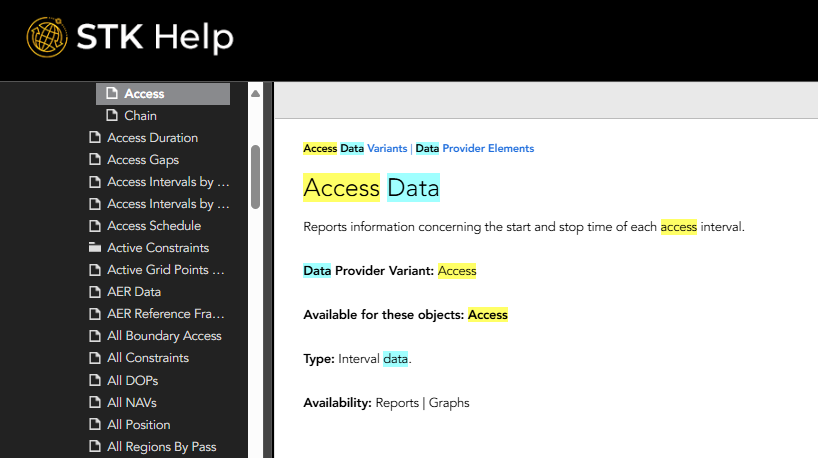
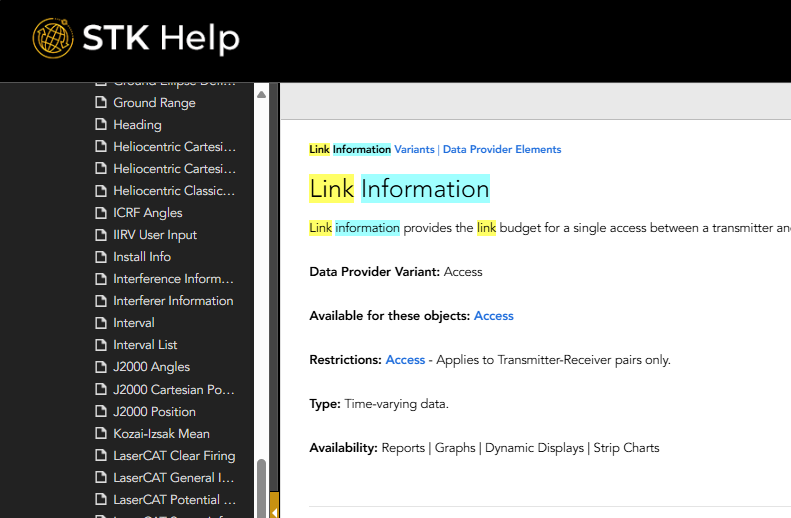
- Certain Data Providers do not work with dynamic graphs. For example, the Access Data data provider is only available for Reports and Graphs, while the Link Information data provider is available for all 4 kinds of reports and graphs: reports, graphs, dynamic displays and strip charts.
How to check if a data provider is available for Dynamic Displays and Strip Charts?
Data providers which are available for this type of Reports and Graphs are the time-varying data providers. But more broadly speaking, any data provider which contains the mention "Dynamic Displays" and "Strip Charts" under the Avaibility field in the STK Help system can work with Dynamic Displays and Strip Charts.
Here are screenshots of the two previous example given:
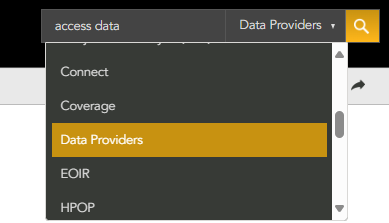
It is also possible to get data provider information on the STK Help page. The search bar allows you to select "Data Providers," this is the easiest and most convenient way to check data providers.
Moreover, whenever you select the "Dynamic Display/Strip Chart, it will automatically prevent you from selecting a graph or report style that include data that is not compatible with the dynamic display/strip chart style.
If you have any further questions or need assistance, we are here to help! Our dedicated Tec-Support team is ready to provide prompt and personalized assistance tailored to your needs. Please don't hesitate to reach out by submitting a ticket by going to https://lsas-tec.freshdesk.com/support/tickets/new. We look forward to assisting you and ensuring a positive experience.
Thanks,
LSAS Tec-Support Team
Was this article helpful?
That’s Great!
Thank you for your feedback
Sorry! We couldn't be helpful
Thank you for your feedback
Feedback sent
We appreciate your effort and will try to fix the article